16 t-Tests
The t-test looks at difference in means between two things (e.g., groups, time, observations). There are three different types of t-tests:
- The one-sample t-test tests how the sample mean relates to the population mean.
- The independent samples t-test has two independent groups. The participants or things in group 1 are not the same as the participants or things in group 2. This is a between-subjects design in which different participants are in the two groups.
- The dependent samples t-test has dependent or paired data. The dependent variable is measured at two different times or for two different conditions for all participants or things. This is a within-subjects design in which case the same participants are in both groups. Note also that if you have a matched groups design, you would also use the dependent samples t-test.
These tests are all what we call parametric tests. This means that they rely on a certain set of assumptions, which must be met, in order for us to be able to trust the results of the test. We shall talk about testing assumptions for the t-tests at the end of this chapter. In this book, we are going to focus on independent and dependent samples t-tests.
What Is a t-Test?
The test statistic we compute when we run a t-test is called t. Here is a generic formula for a t-test (Field, 2013):

When we run a t-test, we compute t for our particular sample and then determine the probability of getting a t that extreme or more extreme if the null hypothesis were true. The larger our t-value, the lower the likelihood of it occurring when the null is true and therefore the smaller the p-value. At some point (usually at p < .05), our p-value is small enough that we think it’s pretty unlikely to get a value that extreme (or more extreme) when the null is true, and so we reject the null hypothesis and conclude that there was a significant difference between our groups, or a significant effect of the independent variable on the dependent variable.
The Independent Samples t-Test
When we run a t-test for independent groups, we first imagine plotting a sampling distribution of all the possible differences between the means of the two groups that we could obtain if the null hypothesis were true, and with the sample size of our particular sample (because the shape of the distribution changes with our sample size, or, more specifically, the degrees of freedom; the larger the degrees of freedom, the thinner the tails of the distribution). Statisticians have handily computed the distribution of t for any different sample size that you want.
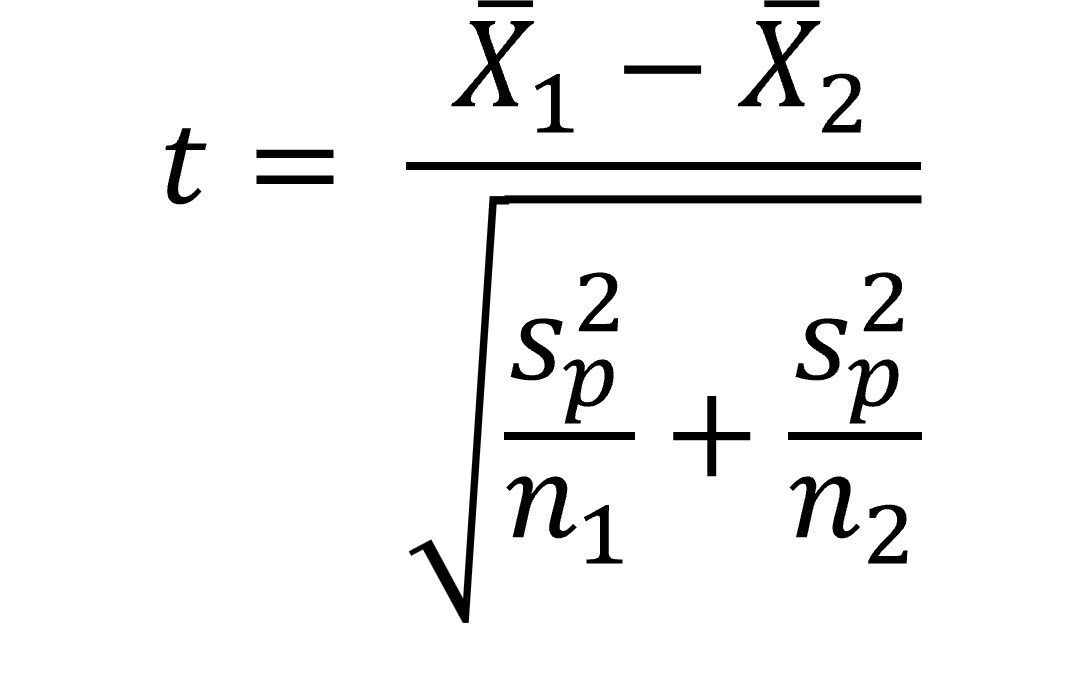
For independent groups, the t-test looks like this (Field, 2013):

Note that we just have the difference between two means as the numerator in the equation. What about the difference between the means when the null is true (which you saw earlier in the chapter)? Well, this is assumed to be zero, and so it drops out of the equation. We divide the difference between our two means by the estimated standard error. How do we compute this standard error when we have two groups? Essentially, we use a weighted average of the variance estimates for each group (weighted based on the sample sizes of each group). The formula below shows you how the pooled variance is calculated (Field, 2013):

(I won’t test you on the pooled variance formula!)
The Dependent Samples t-Test
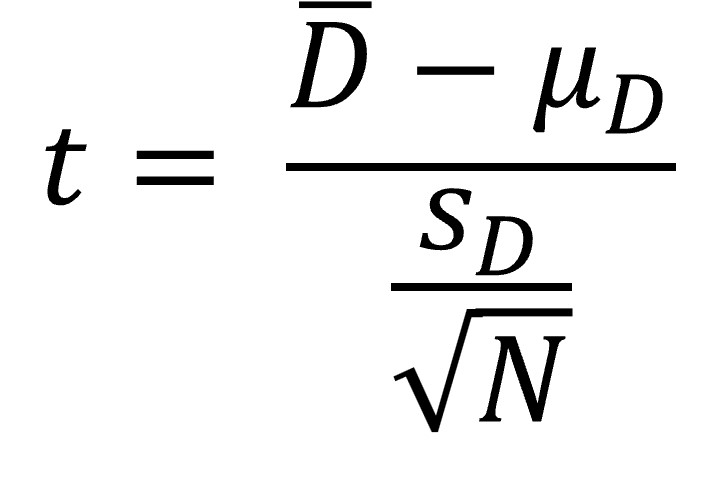
When we run a dependent samples t-test, we are imagining going into the population an infinite number of times and plotting a sampling distribution for all the possible mean differences between the scores in our samples.

D-bar is the mean difference between our samples. μD is the difference we would expect when the null is true (i.e., zero). The standard error in the denominator is the standard error of the differences (computed by dividing the standard deviation by the square root of N, our sample size) (Field, 2013).
