42 Extending the Regression Model: Multiple Regression
Multiple regression is used when we have multiple predictors (continuous and/or categorical) and a single, continuous outcome variable. For example, in the parenthood datafile that we have been working with this chapter, there is another predictor, baby.sleep, which reflects how much sleep the baby had on each of the 100 days. We can add this predictor to the model. When we have two or more predictors, we can test the extent to which one X variable predicts Y, while controlling for the other predictors in the model.
Much of the process for running multiple regression is similar to that for simple regression, but there are some differences, so let’s go through it step-by-step.
1. Look at the Data
This is the same as for simple regression. This time, include both dan.sleep and baby.sleep as Covariates in jamovi, at the same time.
2. Check Assumptions
We shall test all the same assumptions, and add Collinearity statistics. It is an assumption of multiple regression that the predictor variables are not substantially correlated with each other, i.e., no multicollinearity.
Multicollinearity is a problem for three reasons:
- Untrustworthy Bs: As multicollinearity increases, so do the standard errors of the B coefficient. We want smaller standard errors, so this is problematic.
- Limits the size of R, and therefore the size of R2, and we want to have the largest R or R2 possible, given our data.
- Importance of predictors: When two predictors are highly correlated, it is very hard to determine which variable is more important than the other.
Multicollinearity is simply that multiple variables are correlated. We can first just look for general collinearity, or the correlations between all our predictors, using the correlation matrix in jamovi. Any correlations greater than .8 or .9 are problematic. You would either need to drop one variable or combine them into a mean composite variable.
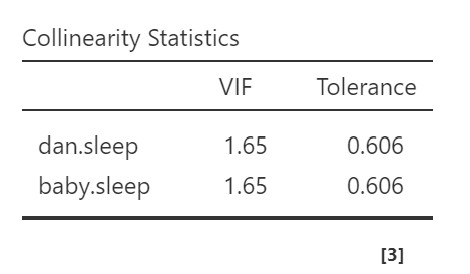
However, to test for multicollinearity, we examine the VIF and Tolerance values. VIF is actually a transformation of Tolerance (Tolerance = 1/VIF and VIF = 1/Tolerance). In general, we want values of 10 or lower for VIF, which corresponds to Tolerance values greater than .2.

In our data, our VIF is 1.65 and Tolerance is .61, so we satisfy the assumption of no multicollinearity.
3. Perform the Test
This is the same as before. Remember to ensure that both dan.sleep and baby.sleep are in the Covariates box.
4. Interpret Results

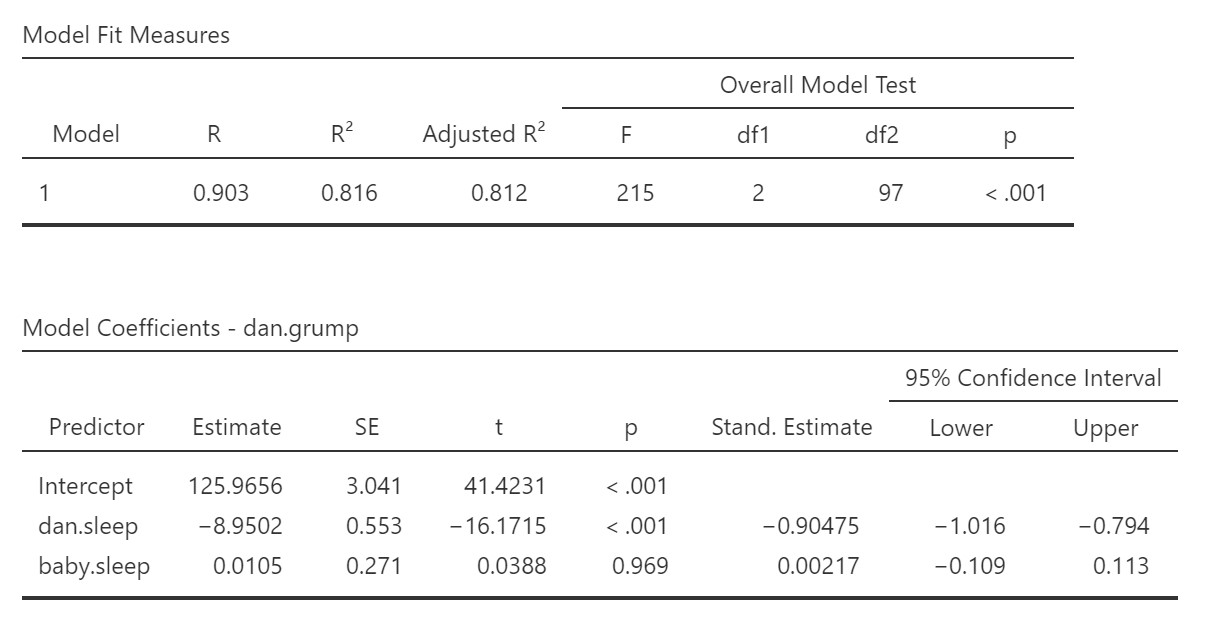
For multiple regression, the R-squared tells us the proportion of the variance in Y explained by all the predictors, X1, X2, and so on, according to how many predictors we have in the model. Similarly, the F statistic give us an overall indication of model fit. The F is significant, so that we know that, together, Dan’s sleep and the baby’s sleep significantly predict Dan’s grumpiness. However, these statistics do not tell us how well each individual predictor predicts the outcome. We have to look at the Model Coefficients table for that. In the second table, we see the regression coefficients for each predictor separately, and a t-test for each of those coefficients to tell us if they each significantly predict Dan’s grumpiness, while controlling for the other predictor(s). We can see that dan.sleep is a significant predictor of dan.grump, but baby.sleep is not.
If we wanted to predict dan.grump based on any given dan.sleep and baby.sleep scores, we could use our regression equation:
dan.grump = 125.97 – 8.95(dan.sleep) + .01(baby.sleep)
If Dan’s sleep was 5 and baby’s sleep was 8, then we’d expect Dan’s grumpiness to be:
y = 125.97 – 8.95(5) + .01(8) = 81.3
The rest of the interpretation is the same as for simple regression.
Write Up the Results in APA Style
When we have multiple regression, we have a few more bits of data to write up. With two predictors, we might still choose to report the results in text form, but with three or more predictors, we would probably report our regression coefficients in a table. For the purposes of illustration, I’ll show you how to do that. I created the table by copying and pasting the model coefficients table from jamovi into Excel, and then editing it within Excel to fit APA format. This time, we shall report the F results and the results of the t-tests because they give us different information (F tells us if the overall model is significant; t tells us if the individual predictors are significant, while controlling for other predictors in the model).
We explored how hours of sleep for Dan and the baby, over 100 days, predicted Dan’s daily grumpiness using multiple regression. Together, Dan’s hours of sleep and the baby’s hours of sleep significantly predicted Dan’s grumpiness, F(2, 97) = 215, p < .001, adjusted R2 = .81. Only Dan’s sleep was a significant predictor of Dan’s grumpiness, while controlling for baby’s hours of sleep (see table 1 below).
Table 1
Dan’s and Baby’s Sleep as Predictors of Dan’s Grumpiness

Categorical Predictors
If you have a single predictor that is categorical, or two or more predictors that are categorical, then regression will simply give you the same results as ANOVA and you should just run an ANOVA. However, if you have one or more continuous predictors, as well as one or more categorical predictors (that are between-subjects variables) then regression will allow you to test these predictors simultaneously. In addition, you can build a model that includes interaction terms. You’ll notice in the example above that there was no interaction, but we could include an interaction between Dan’s sleep and baby’s sleep, if we wished. Let’s say we have a categorical predictor, like whether or not Dan ate breakfast on a given day. We could test whether or not eating breakfast, Dan’s sleep, and baby’s sleep as predictors of Dan’s grumpiness using regression. jamovi (and other statistical software packages) rely on using something called “dummy coding” when including categorical predictors in a regression model. We could also examine some or all of the two- and three-way interactions by building a custom model in the Model Builder of regression jamovi.
These more advanced techniques are beyond the scope of this book, but it is nice to know they are available because they expand the kinds of research questions you can answer with your data. Ask your statistics instructor if you want to use them! If you are keen to learn more right now, you can also check out this website for a straightforward example of regression with one continuous and one categorical predictor in jamovi.
