38 In Practice: Pearson’s Correlation Coefficient
Let’s work through an example in jamovi. Open the “parenthood” datafile in the lsj-data Data Library.
1. Look at the Data
This dataset measures a new mother’s daily grumpiness very precisely, on a scale from 0 (not at all grumpy) to 100 (extremely grumpy). In addition, the dataset tracks her sleeping patterns (hours of sleep) and her son’s sleeping patterns across 100 days. Let’s suppose we are interested in the association between the mother’s sleep (dan.sleep) and her grumpiness (dan.grump) across the 100 days.
Data Set-Up
To conduct the correlation we first need to ensure our data is set-up properly in our dataset. This requires having two columns, one for each of our continuous variables. Each row is a unique participant or unit of analysis. Note that jamovi might have incorrectly imported dan.grump as a nominal variable but that is incorrect! This shows the importance of looking at your data and checking your measure types. Change dan.grump to a continuous variable.
Describe the Data
Once we confirm our data is setup correctly in jamovi, we should look at our data using descriptive statistics and graphs. The descriptive statistics will show you that we have 100 cases and no missing data.
2. Check Assumptions
The Pearson correlation has the three following assumptions:
- Both variables are normally distributed;
- Both variables are measured at the interval or ratio (i.e., continuous) level (however, we will see what we can do if we violate this); and
- The relationship between the two variables is linear.
The third assumption requires looking at a scatterplot of one variable on the x-axis and the other variable on the y-axis.
To test normality, within the descriptive options in jamovi, select the Q-Q Plots. For both dan.sleep and dan.grump, the dots fall pretty close to the straight line. We also have a fairly large sample (100 datapoints) so we are well above the 30 required for central limit theorum to kick in. Therefore, let’s assume we have met the assumption of normality.
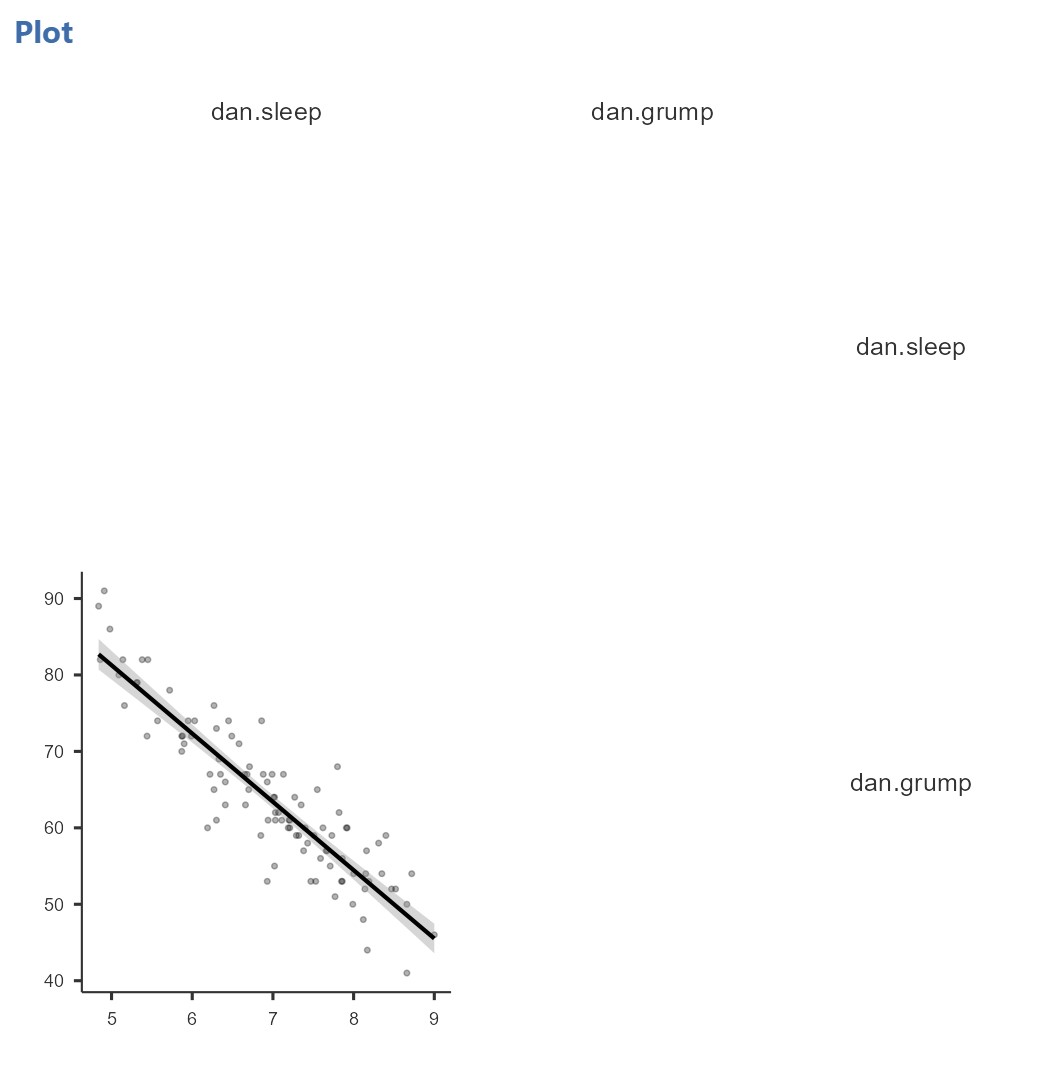
Both variables are interval or ratio data. To check the linearity of the relationship, we should go to the correlation analysis. Under the Analyses button in jamovi, select Regression and Correlation matrix. Move dan.sleep and dan.grump to the box on the right. Under Plot, check the box for Correlation matrix.
The plot will look like this:

We can see quite clearly from looking at the dots on the scatterplot that this is a linear relationship (and not a curvilinear relationship) and so it is appropriate to use Pearson’s r. Note that we need to look at the data points themselves; the correlation matrix will always produce lines even if the underlying data looks curvilinear.
Perform the Test
In addition to the options already selected in jamovi, make sure that the Report significance box is checked, and, if you have missing data, check the box for N. We can also obtain 95% confidence intervals – this will give us a confidence interval around r itself (not around the means).
We also need to decide if we will use a two-tailed test (select Correlated under Hypothesis) or one-tailed test (select Correlated positively or Correlated negatively, according to the expected direction of the relationship). Let’s imagine we had no expectation about the direction of the relationship between sleep and grumpiness.
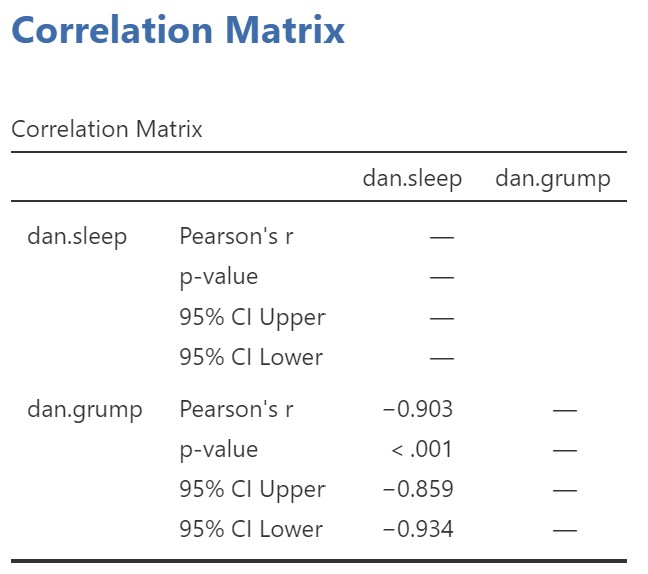
Our results will look like this:
 It looks like there is a strong, negative correlation between sleep and grumpiness. We can write this up in APA format as follows:
Pearson’s correlation indicated that the mother’s sleep duration was significantly associated with her grumpiness, r = -.90, 95% CI [-.93, -.86], p < .001. As the mother got more sleep, her grumpiness decreased.
Note that if we wanted to simultaneously assess the associations among other variables in the dataset, we could enter other variables in jamovi as well, and we would get a correlation matrix showing the correlation between each pair of variables.
Alternatives to Pearson’s r
If we have ordinal data for one or both of our variables (instead of interval or ratio data), we can, instead use Spearman’s rho. This is a non-parametric statistic based on rank order. To perform Spearman’s correlation, both variables need to be in rank order. In jamovi, change the check mark in jamovi from Pearson to Spearman. The interpretation is the same, but you should use rs when reporting your result, instead of r.
